Osborn wave in a patient with COVID-19: a case report
Osborn wave is reflected as a late positive wave following the QRS complex. It can also be interpreted as a serrated descending R-wave in the form of an additional r-wave. This electrocardiographic (ECG) change is associated not with abnormal depolarization of the myocardium, but with repolarization, which is confirmed by J point deflection, which is the initial part of the ST segment. In 1920-1922, a similar ECG performance was described by Kraus F in hypercalcemia [1], and in 1938 by Tomaszewcki W in patients with hypothermia [2]. In 1953, in experiments on dogs under conditions of hypothermia, Osborn JJ demonstrated the J-point elevation in the ventricular ECG complex [3]. Since 1955, hypothermic waves have been named after him. Currently, the critical factor in Osborn wave is considered to be the transmural voltage gradient due to the heterogeneity of the outgoing potassium current in the ventricle [4], arising from various disorders.
The clinical significance of the Osborn wave is specified by its predictive value as a predictor of ventricular fibrillation and sudden cardiac death. The appearance of this wave is a very unfavorable prognostic factor, which increases the risk of ventricular fibrillation. In patients with hypothermia, the association of characteristic ECG abnormalities with ventricular fibrillation in 1957 was confirmed by Fleming PR and Muir FH [5]. As shown earlier, in patients with nervous system diseases, Osborne wave was accompanied by a clinical deterioration [6]. Cases of Osborn wave detection have been described in patients with coronary artery disease, both with previous myocardial infarction (MI) [7] and in patients with vasospastic angina, complicated by ventricular fibrillation [8].
We present a case of Osborn wave detection in a patient with coronavirus disease 2019 (COVID-19) and lung damage.
Case report
Complaints and anamnesis. Seventy-two-year-old female patient was admitted with complaints of dyspnoea at rest, weakness, fever up to 38,50C, loss of taste, and bitter taste. She considered herself ill for 2 weeks, when the above symptoms first appeared. She took a combination of analgin and diphenhydramine on her own, and did not notice any improvement in the next 10 days. After the appearance of severe shortness of breath during normal physical activity, she applied to the clinic. Despite taking prescribed antiviral therapy (oseltamivir 75 mg/day), shortness of breath increased over the next 3 days. Computed tomography (CT) revealed bilateral ground-glass opacities (48%), after which she was admitted to the COVID-19 Bashkir State Medical University Clinic.
She had history of hypertension (HTN) for 6 years. She regularly took antihypertensive drugs (amlodipine 5 mg/day, telmisartan 40 mg/day), antiplatelet agents (acetylsalicylic acid 50 mg/day) and statins (atorvastatin 20 mg/day).
Objective status on admission was moderate, conscious, body temperature of 37,70C, heart rate of 92 bpm, blood pressure of 126/82 mm Hg. Respiratory rate was 22 breaths per minute. Blood oxygen saturation (SpO2) was 94%.
Diagnostic tests. Blood tests revealed nonspecific signs of inflammation. In the complete blood count, leucocytosis up to 10*109/L and elevated erythrocyte sedimentation rate of 50 mm/h was detected (Table 1). In a biochemical blood tests, C-reactive protein (CRP) was significantly increased to 88,4 mg/L, creatine phosphokinase (CPK) — 261 U/L, lactate dehydrogenase (LDH) — 447 U/L, and aspartate aminotransferase (AST) — 49,5 U/L (Table 2). No SARS-CoV-2 RNA was detected in nasopharyngeal swabs by the polymerase chain reaction, but it was detected 3 days before the patient was admitted to the hospital. Also, upon admission, an increase in anti-SARS-CoV-2 IgM to 7,6 U was
revealed. Only low concentration of IgG was determined.
Table 1
Complete blood count dynamics
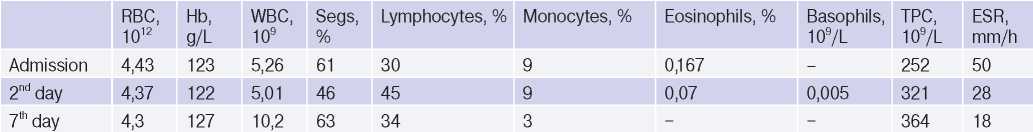
Abbreviations: RBC — red blood cells, Hb — haemoglobin, WBC — white blood cells, Segs — segmental neutrophils, ESR — erythrocyte sedimentation rate.
Table 2
Biochemical blood test dynamics
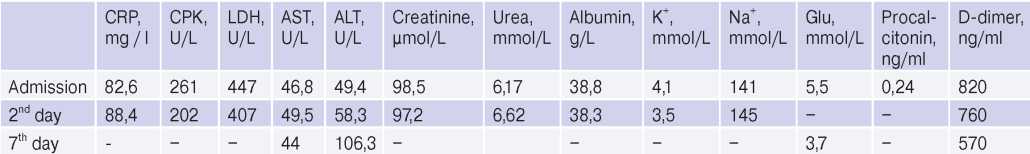
Abbreviations: ALT — alanine aminotransferase, AST — aspartate aminotransferase, CPK — creatine phosphokinase, LDH — lactate dehydrogenase, CRP — C-reactive protein.
There were no potassium and sodium levels’ abnormalities in the blood serum (Table 2). Blood albumin concentration corresponded to the lower reference value. Carbohydrate metabolism parameters were within normal range. The serum procalcitonin level used as a marker of bacterial superinfection was also within the acceptable range. A moderate increase in D-dimer with a gradual decrease in its activity was revealed.
On admission, ECG (Figure 1) was characterized by sinus rhythm, heart rate of 85 bpm, left axis deviation. PQ =0,18 sec, QRS =0,08 sec, QT =0,30 sec, QTcor =0,36 sec. Osborn wave was recorded in I, II, aVL leads. Moderate repolarization impairment in the left ventricular (LV) anterior apical area (ST segment elevation by 1,0 mm in V3-4 with a biphasic T wave in V1-4). The control ECG (Figure 2) showed an increase in Osborn wave amplitude in I, II, aVL leads, its appearance in V6, an improved repolarization in V3-4. There was no Osborn wave on the available ECGs before the patient was admitted to the hospital. The last ECG was performed 1 year before admission to the hospital.
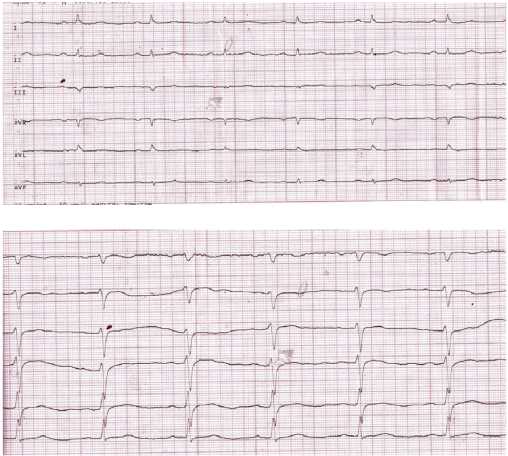
Figure 1. Initial ECG of the 72-year-old female patient: limb and precordial leads.
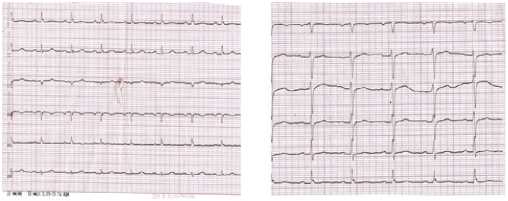
Figure 2. Initial ECG of the 72-year-old female patient after 6 days.
According to chest CT upon admission, there was uneven pneumatization of the pulmonary fields, with alternating areas of moderately low and high airiness (Figure 3). In both lungs, there were multilobar, multisegmental bilateral ground-glass opacities. The upper right lobe is damaged up to 5%, the middle right lobe — 50%, and the lower right lobe — 50%. The upper left lobe is damaged up to 25%, the lower left lobe — 50% (Figure 3). Conclusion: CT showed bilateral multisegmental pneumonia (interstitial infiltration). The lung involvement was 48%. After 5 days, additional CT revealed decrease in the size of ground-glass opacities in both lungs. Conclusion: CT showed bilateral multisegmental pneumonia (interstitial infiltration) with a positive trend in comparison with previous CT scan. The lung involvement was 48%.
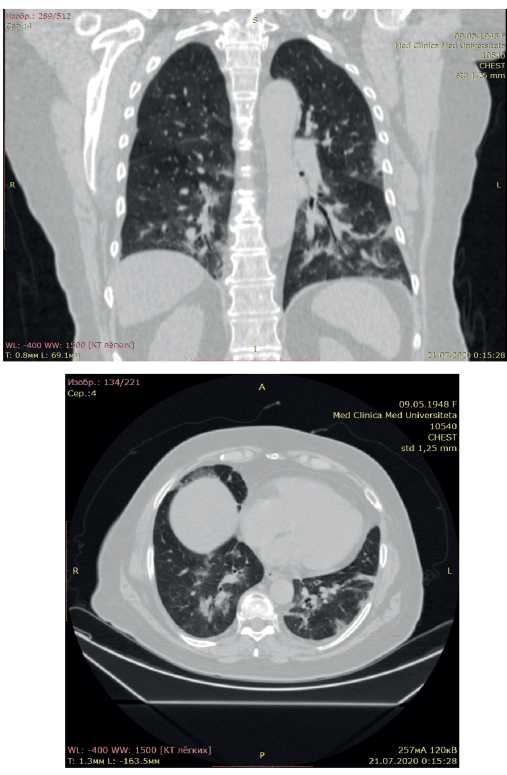
Figure 3. Chest CT scan of the 72-year-old female patient with COVID-19 pneumonia. The lung involvement of 48%.
The patient received anti-inflammatory and immunosuppressive therapy in accordance with the Ministry of Health of the Russian guidelines: hydroxychloroquine at a dose of 200 mg (400 mg 2 times a day for 2 days, then 200 mg 2 times a day); methylprednisolone at a dose of 1 mg/kg every 12 hours for 4 days, with a transition to a maintenance dose of 8 mg a day for 3 days, then 6 mg a day for 3 days; anticoagulant therapy — enoxaparin sodium 0,4 ml 1 time a day for 10 days, paracetamol 500 mg (with fever >380C); ambroxol 30 mg 3 times a day. Antihypertensive therapy was continued with calcium channel blockers and sartans in previously selected individual doses. Statin therapy at maintenance doses providing targeted low-density lipoprotein levels was also continued.
The patient was discharged with improved condition 10 days after admission: there were no shortness of breath, cough and fever. SpO2 rose to 98-99% 3 days before discharge from the COVID-19 hospital.
This study was performed in accordance with the Helsinki declaration and Good Clinical Practice standards. The medical ethics committees of all participating centers approved this study. All patients signed informed consent.
Discussion
The guidelines for the prevention, diagnosis and treatment of COVID-19 indicate that, despite the many clinical and morphological masks of COVID19, cardiac damage is in the first place after lungs among other organs and systems. Possible development of myocarditis or myocardial infarction against the background of coronary artery thrombosis due to viral endothelial injury [9].
The literature describes the classic Osborn wave not only in hypothermia, but also in such various pathological conditions and diseases with normal body temperature as hypercalcemia, postoperative pericarditis, after clinical death, cocaine use, haloperidol overdose, various types of coronary artery disease (after MI and vasospastic angina), nervous system diseases [5-8][10-12].
In the current case report, the Osborn wave was determined on the ECG upon admission to the hospital with COVID-19 and specific pneumonia. This wave was identified in I, II, aVL, V6 leads. An increase in nonspecific myocardial damage markers (LDH by 2,1 times, CPK by 1,6 times), liver transaminase (AST by 1,6 times), inflammatory biomarker (CRP by 14,6 times) had a more pronounced dynamics compared to patients with COVID-19-related myocarditis described in the literature. Due to the retrospective design, specific cardiac enzymes were not detected in this patient.
Although the available literature does not describe these ECG changes in COVID-19, previously shown arrhythmias may be the result of an abnormal electric wave course during the switch from depolarization into repolarization due to intra- and extracellular calcium pool imbalance. Thus, experimental studies have shown that the initial transmural electrical heterogeneity (in the presence of Osborn wave) can be significantly aggravated under certain conditions (use of drugs and electrolytes, autonomic tone changes), which can lead to fatal arrhythmias [13]. On the other hand, cardiac arrhythmias are of great predictive value for the survival of patients with COVID-19. For the first time, ectopic activity, as well as an increase in pre-existing paroxysmal tachycardia episodes, may reflect myocardial damage during a viral infection. For example, in 7,3% of patients with COVID-19, palpitations were one of the first symptoms of the disease [14]. In general, the prevalence of detected cardiac arrhythmias in patients with COVID-19 was 15,7%. In the intensive care unit, arrhythmias were detected in almost every second patient with COVID-19 [15]. With an increase in the troponin damage marker, lifethreatening arrhythmias (ventricular tachycardia/ventricular fibrillation) were recorded in 11,5% of cases, which also did not rule out the viral myocarditis against the background of COVID-19 [16].
Sala S, et al. [17] described a 43-year-old female patient with acute viral myocarditis in COVID-19 (SpO2, 89%) and ECG abnormalities in the form of ST segment elevation in V1-V2 leads and reciprocal changes in V4-V6. The corrected QT interval was 452 ms; a U-wave was observed in most ECG leads. However, according to ECG records presented by the authors, the QRS complexes in II, III, aVF leads, in our opinion, had change that resembled an Osborn wave [17]. Biomarkers of myocardial damage were increased (high-sensitivity troponin, N-terminal probrain natriuretic peptide and CRP). Echocardiography revealed a moderate decrease in LV myocardial contractility (LV ejection fraction (LVEF) — 43%) and inferolateral hypokinesia. Contrast-enhanced cardiac magnetic resonance (7th day of admission) revealed myocardial oedema as pseudohypertrophy without myocardial scarring, with an increase in contractility (LVEF increased to 65% with persisting moderate hypokinesia). The diagnosis of acute COVID-19-related virus-negative myocarditis was finally confirmed by endomyocardial biopsy [17].
Thus, ECG abnormalities similar to Osborn wave, in addition to typical cases of hypothermia described in the literature, can be a sign of COVID-19, as a reflection of disturbed electrolyte current in cardiomyocytes against the background of oxidative stress, and can become a predictor of future fatal cardiac arrhythmias, which will require long-term ECG monitoring in discharged patients. The appearance of the Osborn wave may be associated with violated intraventricular conduction. In particular, in the patient described by Sala S, et al. [17], QRS complex width and corrected QT interval were at the upper normal limit — 452 ms, which may be associated with the ongoing antiviral therapy (hydroxychloroquine at a dose of 200 mg). In our case, normal values of QRS complex width (80 ms) and corrected QT interval (360 ms) were noted, although the patient also took hydroxychloroquine. In general, taking into account such variability of ECG parameters, according to current Russian guidelines for the diagnosis and treatment of COVID-19 [9], it is necessary to monitor corrected QT interval in all patients receiving specific therapy (hydroxychloroquine, antibiotics).
Study limitations. ECG abnormalities were found retrospectively, which did not allow timely echocardiography and analysis of specific serum cardiac enzymes.
Conclusion
The Osborn wave in patients with COVID-19 pneumonia may be associated with intraventricular conduction impairment, myocardial electrolyte disturbances and the effect of causal treatment. Unfortunately, viral myocarditis cannot be established due to absence of a specific diagnosis of the disease (specific cardiac markers, magnetic resonance imaging, myocardial biopsy). In a similar fashion, given the risk of fatal arrhythmias in patients with the classic Osborn wave in hypothermia, patients with COVID-19 and Osborn wave require long-term ECG monitoring after discharge from the hospital. In the future, it will be possible to assess the reproducibility of the Osborn wave in COVID-19, as well as its significance in terms of cardiovascular events’ development.