Comprehensive Echocardiographic Assessment of the Right Ventricular Performance: beyond TAPSE and Fractional Area Change
Introduction
Over the last few decades the right ventricle (RV) gained recognition as a key player in cardiac (patho-) physiology and independent predictor of adverse events and mortality in patients with heart failure, pulmonary hypertension, coronary artery disease, left ventricular (LV) dysfunction, congenital heart disease, respiratory distress syndrome, and even in general population of patients undergoing clinically indicated transthoracic echocardiography [1][2][3][4]. Precise evaluation of the RV performance is considered crucially important but challenging task due to RV complex geometry and myocardial fiber architecture, prominent trabeculation and its sensitivity to loading conditions.
Being widely available, safe, and relatively inexpensive imaging modality suitable for various clinical settings, echocardiography remains a cornerstone in the RV assessment. However, conventional echocardiographic parameters of the RV systolic function, although being commonly used in clinical routine, have a number of important limitations, under specific conditions poorly correlate with a gold-standard imaging modality — cardiac magnetic resonance (CMR) [5][6], and can be misleading. Introduction of novel echocardiographic techniques, such as three-dimensional echocardiography (3DE) and twodimensional speckle-tracking echocardiography (2DSTE) helped to achieve a level of accuracy in the assessment of RV comparable to that obtained by CMR [7][8].
This manuscript provides the state-of-the-art review of currently available echocardiographic techniques for the assessment of the RV systolic function with an emphasis on their advantages, limitations and pitfalls, and a practical approach for a comprehensive assessment of the RV performance in various clinical scenarios.
Main mechanisms of RV contraction
The following key mechanisms are responsible for the RV pump function: (1) shortening in the longitudinal axis with traction of the tricuspid valve towards the apex; (2) inward motion of the RV free wall; (3) bulging of the interventricular septum into the RV cavity during the LV contraction and stretching the RV free wall over the septum; and (4) contraction of the right ventricular outflow tract (RVOT) [9]. Evaluation of all these components is crucial for an accurate assessment of the RV systolic function and mechanics.
Understanding the complexity of the RV contraction patterns as well as advantages and limitations of the different echocardiographic techniques are key factors in choosing the most appropriate diagnostic parameters relevant to the clinical scenario and of utmost importance for a comprehensive evaluation of RV performance.
RV systolic function: beyond surrogate parameters
The RV systolic dysfunction is an independent predictor of cardiovascular morbidity and mortality in various conditions [2][10][11]. In the absence of a single reliable measure in conventional echocardiography, a number of surrogate echocardiographic parameters of RV performance (such as tricuspid annular plane systolic excursion (TAPSE), peak S wave velocity of the lateral tricuspid annulus by tissue Doppler imaging (S’), RV fractional area change (FAC), and RV myocardial performance index) have been introduced for clinical use. Their abnormality thresholds, as well as main strengths and limitations are summarized in Table 1. Despite most of them being fast and easy to use, they often do not provide objective information about the global RV systolic function but measure only part of the complex RV contraction. Subsequently, multiparametric approach is highly recommended while assessing the RV systolic function by conventional echocardiography, and the situations when there is a discrepancy between conventional parameters of RV systolic function are not rare in routine clinical practice.
Table 1
Normal values for conventional echocardiographic parameters in assessing systolic function of the RV [20]
| Parameter | Abnormality threshold | Advantages | Limitations | Essential for correct use |
|---|---|---|---|---|
| TAPSE (mm) | <17 | — Easy to obtain
— Less dependent on image quality — Established prognostic value |
— Reflects only the longitudinal function
— Neglects the contribution of the interventricular septum and the RVOT — Angle and load dependent — Uses extracardiac reference point |
— Good alignment
— Cannot be used in patients post pericardiotomy/cardiac surgery |
| Pulsed wave Tissue Doppler S’ wave (cm/sec) | <9,5 | — Easy to perform
— Reproducible — Validated against radionuclide EF — Established prognostic value |
— Reflects only the longitudinal function
— Neglects the contribution of the interventricular septum and the RVOT — Angle and load dependent |
— Good alignment
— Not fully representative of RV global function, particularly after cardiac surgery |
| FAC (%)
FAC=(EDA+ESA)/EDA |
<35 | — Reflects both longitudinal and radial components of RV contraction
— Established prognostic values — Correlates with RV EF by CMR |
— Requires good endocardial border delineation
— Neglects the contribution of RVOT to overall function — Only fair inter-observer reproducibility |
— Sufficient image quality (endocardial delineation) |
| Pulsed wave Doppler RIMP RIMP=(TCO-ET)/ET | >0,43 | — Established prognostic value | — Requires matching for R-R intervals when measurements are performed on separate recordings
— Unreliable when RA pressure is elevated — Limited use in normal RV |
— Regular heart rhythm
— Sufficient Doppler signal |
| Tissue Doppler RIMP RIMP=(IVRT+IVCT)/ET | >0,54 | — Less affected by heart rate
— Single-beat recording with no need for R-R interval matching |
— Unreliable when RA pressure is elevated | — Good alignment |
Abbreviations: CMR — cardiac magnetic resonance, EDA — and-diastolic area, EF — ejection fraction, ESA — end-systolic area, ET — ejection time, FAC — fractional area change, IVRT — isovolumic relaxation time, IVCT — isovolumic contraction time, IVS — interventricular septum, RA — right atrium, RIMP — right ventricular index of myocardial performance, RV — right ventricle, RVOT — right ventricular outflow tract, TAPSE — tricuspid annulus peak systolic velocity, TCO — tricuspid closure — opening time.
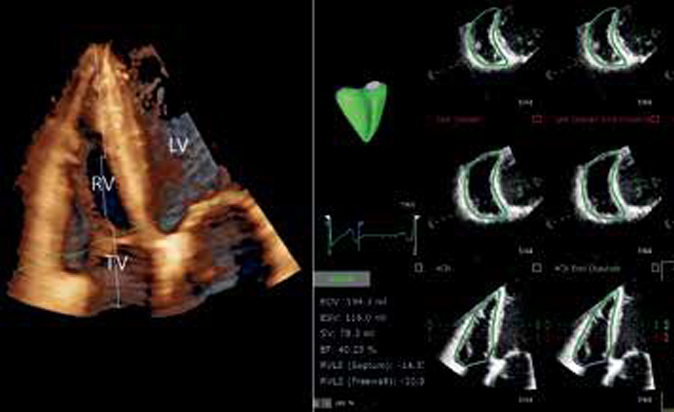
Importantly, only RV ejection fraction (EF) provides an adequate assessment of true global RV pump function, and 3DE remains the sole echocardiographic technique capable of direct measurement or RV end-diastolic and end-systolic volumes and reliable calculation of RV EF. Unlike two-dimensional echocardiography (2DE), it enables full volume 3DE datasets acquisition derived from either a single beat capture or few consecutive multibeat volumes stitched together with higher temporal and spatial resolution, which can be postprocessed using dedicated software packages to obtain the mapping of the RV endocardial surface and the measurements of the RV volumes and EF (Fig. 1). 3DE-derived RV volumes closely correlate (but slightly underestimate) with CMR-derived RV volumes both in children and adults [12][13][14][15], and with volumes obtained during cardiac catheterization by volumetric thermodilution method [16]. In the recent meta-analysis exploring the accuracy of different imaging modalities (2DE, 3DE, radionuclide ventriculography, computed tomography, gated single-photon emission computed tomography, and invasive cardiac cinevent- riculography) for the RV EF assessment using CMR as reference method, 3DE has proven to be the most reliable technique, overestimating the RV EF only by 1,16% with the lowest limits of agreement (form -0,59 to 2,92%) [17]. Importantly, as many other parameters of systolic function, RV EF is sensitive to significant RV volume- or pressure overload and should always be considered in the context of RV loading conditions. Reference values for 3DE RV volumes and EF including age-, body size-, and sex- specific reference values based on large cohort studies of healthy volunteers has recently become available [18][19]. Current chamber quantification guidelines for the first time included recommendations for 3DE analysis of the RV and cut-off values for RV volumes and EF (Table 2) specifying RV EF >45% as the lower limits of normal [20]. In the recent study, partition values of the RV EF to classify RV systolic dysfunction as mild (40-45%), moderate (30-40%) or severe (<30%) have been introduced and their prognostic value validated [21].
Table 2
Normal values for 3DE-derived RV volumes and EF [20]
| Dimension | Normal values (mean±SD) | Abnormality threshold |
|---|---|---|
| EDVi (ml/m2) Men | 61±13 | >87 |
| Women | 53±10,5 | >74 |
| ESVi (ml/m2) Men | 27±8,5 | >44 |
| Women | 22±7 | >36 |
| EF (%) | 58±6,5 | <45 |
Abbreviations: 3DE — three-dimensional echocardiography, EDVi — index of end-diastolic volume, EF — ejection fraction, ESVi — index of end-systolic volume, RV — right ventricle, SD — standard deviation.

Figure 1. 3DE analysis of full volume data set of the RV obtained from the RV-focused apical four-chamber view with adjusted depth and volume width to encompass the entire RV. (A) Volume rendering demonstrating the RV anatomy; (B) Semiautomatic identification of the RV endocardial surface in end-diastole and end-systole; (C) Final result of the 3DE volumetric analysis of the RV with the surface rendered 3D model of the RV (green model) combining the wire-frame (white cage) display of the end- diastolic volume. Surface rendered dynamic model changes its size and shape throughout the cardiac cycle enabling the visual assessment of the RV dynamics and quantitation of RV volumes and EF.
Abbreviations: EDV — end-diastolic volume, EF — ejection fraction, ESV — end-systolic volume, LV — left ventricle, RV — right ventricle, SV — stroke volume, TV — tricuspid valve.
Figures 2 and 3 provide two practical examples of an added value of the 3DE volumetric analysis of the RV in routine clinical practice. Despite normal value of TAPSE in a patient with pulmonary hypertension (Fig. 2), global systolic function was reduced due to a significantly impaired radial contraction of the RV free wall and flattening of the interventricular septum (which was not taken into account by TAPSE but reflected by FAC). Conversely, in a patient with repaired Tetralogy of Fallot (Fig. 3), TAPSE and S’ were reduced post cardiac surgery, however the radial contraction appeared preserved (FAC >35%), however the global RV EF was still impaired due to dilated and akinetic RVOT which was not included neither in TAPSE nor in FAC measurements.

Figure 2. Echocardiographic assessment of the RV systolic function in a patient with pulmonary hypertension. There is a discrepancy between values of two conventionally used parameters of RV performance (Normal TAPSE — Panel A, and reduced FAC — Panel B). Panel C shows the surface rendered 3D model of the RV at end systole (green model) combining the white wire-frame representing the end-diastolic volume. It’s clearly seen that the longitudinal contraction is preserved (white arrows), but radial is significantly impaired (red arrows) due to reduced RV free wall motion and flattening of the interventricular septum. Panel D demonstrates the final result of 3DE volumetric analysis of the RV with reduced RV EF (37%).
Abbreviations: EDA — end-diastolic area, EDV — end-diastolic volume, EF — ejection fraction, ESA — end-systolic area, ESV — end-systolic volume, FAC — fractional area change, SV — stroke volume, TAPSE — tricuspid annular plane systolic excursion.

Figure 3. Echocardiographic assessment of the RV systolic function in an adult patient with repaired Tetralogy of Fallot. (A) Four-chamber view showing abnormal shape of the RV and dilated RV compared to the LV size. There is again a discrepancy between values of conventionally used parameters of RV performance: reduced TAPSE and S’ (Panels B and C), frequently seen in patients post cardiac surgery, but normal FAC (Panel D). However, when the 3DE volumetric analysis was performed (Panel E), the RV EF was reduced due to dilated and akinetic RVOT which was not taken into account neither in TAPSE nor in S’ or FAC measurements.
Abbreviations: EDA — end-diastolic area, EDV — end-diastolic volume, EF — ejection fraction, ESA — end-systolic area, ESV — end-systolic volume, FAC — fractional area change, SV — stroke volume, TAPSE — tricuspid annular plane systolic excursion.
Important limitations of 3DE assessment of the RV volumes and EF include dependency on image quality, with suboptimal imaging affecting the accuracy of the analysis, especially on a stage of identification of the endocardial surface. Other potential limitations are incomplete visualization of the whole cardiac chamber including RVOT in case of severe RV dilation, possible dropout artefacts of the RV anterior wall, need for regular heart rate and patients’ cooperation in case of multibeat acquisition. However, specific advantages of 3DE over other imaging modalities including its portability, absence of ionizing radiation, and the ability to examine patients with intracardiac devices, as well as recent technological advances, such as single-beat 3DE data acquisition with high volume rate and availability of the software packages for the volumetric analysis of the RV on board of the echocardiographic scanners, make 3DE one of the most versatile technique to assess the RV performance.
Although acquisition of good quality 3DE full volume dataset of the RV and quantification of the RV volumes and EF requires certain level of training and expertise, in echocardiographic laboratories with appropriate 3D platforms and experience 3DE-derived RV EF should be considered a method of choice for assessment of the RV systolic function [20].
Role and relative contribution of different components of the RV systolic function
As mentioned above, global RV performance is a result of a complex interplay between different wall motion components. Traditionally, it was believed that the longitudinal contraction is far the major contributor to RV function and therefore, its assessment by echocardiography is adequate by such parameters that solely refer to longitudinal shortening (TAPSE, S’, longitudinal strain). However, the implementation of 3DE enabled more granular understanding of RV shape and mechanics [22]. A recent study revealed that the inward motion of the free wall (radial shortening, the so-called „bellows effect”) and interestingly, the anteroposterior shortening (mainly caused by the stretching of the RV free wall insertion points by the LV contraction) are of comparable significance to longitudinal shortening in healthy volunteers [23]. The bellows effect is justified by the circumferentially oriented myofibers which prevail at the subepicardial layer of the RV myocardium [22]. Importantly, FAC at least partly captures radial motion in a simple 2D plane, however, there are absolutely no conventional 2DE parameters that incorporate anteroposterior motion. These results emphasize the importance of 3DE imaging in the thorough assessment of RV function. Moreover, the latter study also found that elderly individuals with a relative pulmonary hypertension represent a distinct population as the radial motion starts to decrease as pulmonary pressures increase. Other studies with similar 3D methodological approaches have also highlighted that the loss of „bellows motion” can be an early and sensitive sign of RV pressure overload, thus, 3DE may be used for screening purposes in patients with suspected pulmonary hypertension or even in heart failure with preserved EF patients, where RV dysfunction plays a key role in the disease course [24][25]. There are other types of RV mechanical patterns: i.e. after open- heart surgeries. There is an instantaneous shift in the RV contraction at the opening of the pericardial sac: as normal pericardial constraint vanishes the longitudinal shortening will significantly decrease; however, global EF remains maintained due to effective compensation by the radial motion. A recent follow-up study in patients underwent mitral valve replacement or repair confirmed the temporary nature of this phenomenon as 6-months later the normal relative contribution of the aforementioned wall motion directions was restored [26]. Heart transplanted patients represent quite a different patient subpopulation, as the dominance of radial motion seems long-lasting and parameters referring only to longitudinal shortening will report dysfunction for quite a long time after the operation (Fig. 4) [27]. As such, multiparametric 2DE assessment of the RV including FAC is of pivotal importance in these patients. Athlete’s heart is another clinical scenario where advanced imaging provides significant additional value on top of conventional 2D assessment. RV volumes and mechanics are independent predictors of aerobic exercise capacity [28]. Moreover, a predominance of longitudinal shortening along with a relative decrease in radial motion can be measured even during resting conditions in healthy elite athletes [29]. Further research should also concentrate on specific congenital heart diseases (i.e. in case of RV volume overload, Tetralogy of Fallot, etc.) where the performance of the RV is even more a driver for future events and survival. The separate quantification of the different motion components provides a comprehensive and clinically meaningful characterization of RV contraction pattern and these changes are often prevalent even in the face of normal RVEF.

Figure 4. Schematic representation of the results from the original article by Lakatos et al. (https://doi.org/10.1111/ctr.13192) 3D reconstructions of three representative RVs; the white mesh represents the end-diastolic volume, the green surface represents the end-systolic volume of the corresponding RV. During physiological conditions (Normal) the relative contributions of longitudinal and radial shortenings are similar. In the early postoperative period after heart transplantation (Early HTX), the radial motion becomes dominant and maintains global function in face of decreased longitudinal shortening. Years after the operation (Late HTX), longitudinal contraction may partly recover.
Abbreviations: LV — left ventricle, RV — right ventricle.
RV wall motion abnormalities
Similar to the assessment of LV wall motion abnormalities, evaluation of the RV wall motion can provide valuable information since some pathological conditions are characterized by specific patterns of RV regional contraction. Localized RV dyskinesia or aneurysm is a diagnostic criterion for arrhythmogenic RV cardiomyopathy [30]. Hypokinesia of the RV free wall combined with the normal contraction of the RV apex (McConnell sign) in the presence of RV pressure overload is a typical finding in patients with acute pulmonary embolism [31], including those developing pulmonary embolism as a part of COVID-19 infection course (Fig. 5). Patients with myocardial infarction due to thrombosis of the right coronary artery may have right ventricular damage with typical ischaemic wall motion abnormalities of the RV (Fig. 6). It has been shown that patients with inferior myocardial infarction who also have RV dysfunction are at increased risk of adverse cardiovascular events and death, and this increased risk is related to the presence of RV myocardial involvement itself rather than the extent of LV myocardial damage [32][33]. RV wall motion abnormalities could be also seen in patients with congenital heart disease and are known to be prognostically important (Fig. 7) [34].

Figure 5. McConnell sign in a ventilated patient with acute respiratory distress syndrome due to COVID-19 and acute pulmonary embolism. (A) RV-focused four-chamber view in end-diastole demonstrating dilated RV. There is large mobile intracavity thrombus (white arrow in all Panels). (B) End-systolic frame of previous view showing severe hypokinesia of the RV free wall (red arrows) combined with the good contraction of the RV apex (yellow arrows) — McConnell sign. (C) Subcostal view showing large mobile RV thrombus seen in apical images.
Abbreviations: LV — left ventricle, RV — right ventricle.

Figure 6. Transthoracic echocardiography of a patient with inferior myocardial infarction due to thrombosis of right coronary artery who presented with dilated RV and severe tricuspid regurgitation. (A) Two-chamber view of the LV showing bright, thin and akinetic inferior wall (scar). (B) LV global longitudinal strain with significant reduction of segmental values in the territory of the right coronary artery. LV GLS is reduced (-15,2%). (C) Parasternal short axis view demonstrating dilated RV and bright akinetic area in the inferior RV wall (arrows) due to RV infarction. (D) Parasternal RV inflow-outflow view showing bright, thin and akinetic inferior RV wall (arrows).
Abbreviations: LV — left ventricle, RA — right atrium, RV — right ventricle.

Figure 7. Severely dilated aneurysmatic RVOT (arrows) in an adult patient with repaired Tetralogy of Fallot and severe pulmonary regurgitation. Abbreviations: AV — aortic valve, PV — pulmonary valve, RVOT — right ventricular outflow tract.
RV myocardial deformation
Being sensitive to loading condition, conventional parameters as well as the 3DE-derived RV EF are not the best indicators of the RV performance in patients with significant pressure or volume overload. Myocardial deformation imaging, and in particularly 2DSTE derived RV longitudinal strain, is the least load dependent index of RV systolic function and can be more accurate under loading conditions. Figure 8 demonstrates reduced values of RV longitudinal strain in a patient with severe tricuspid regurgitation, despite normal TAPSE and S’.

Figure 8. Echocardiographic assessment of the RV systolic function in a patient with pulmonary hypertension and severe tricuspid regurgitation. (A) Color Doppler demonstrating severe functional tricuspid regurgitation. (B) Continuous wave Doppler image demonstrating severe tricuspid regurgitation and elevated pulmonary artery pressures. (C) Normal value of TAPSE in the settings of volume overload (TAPSE 18mm) and (D) normal S’ (S’ 0,12 m/s). (E) Significantly reduced fractional area change (FAC 23%) due to significantly reduced radial contraction. (F) Peak systolic longitudinal strain of the RV free wall and RV four-chamber longitudinal strain obtained with 2DSTE. Colored curves show the segmental strain change during the cardiac cycle, and white dotted line shows the averaged RV strain changes during the cardiac cycle. In this patient RV free wall and four-chamber (global) longitudinal strain were reduced, despite normal TAPSE and S’, highlighting that 2DSTE-derived strain is less loading dependent than other parameters of RV systolic function. 3DE RV EF in this patient was measured as 30,7%.
2DSTE RV longitudinal strain has an independent prognostic value demonstrated in patients with pulmonary hypertension, heart failure, LV dysfunction, congenital heart diseases, storage diseases, and cardiomyopathies [3][35][36][37]. Importantly, the predictive value of 2DSTE RV longitudinal strain was higher than of other conventionally used echocardiographic parameters of RV systolic function (TAPSE, FAC) and CMR parameters (CMR-derived RV EF, feature tracking RV global longitudinal strain) to predict all-cause mortality and cardiac death in patients with heart failure with reduced LV EF [38]. Reduced RV free wall longitudinal strain remained a marker of poor prognosis even if TAPSE was normal in a large cohort of asymptomatic patients with LV disease [3].
Due to its current high availability in echocardiographic laboratories and introduction of (semi-)automated software packages, 2DSTE-derived longitudinal strain has emerged as a new reliable technique for the assessment of RV mechanical changes, which is fast and easy to use, highly reproducible and less angle dependent than many other conventional parameters [39][40].
To ensure high reproducibility and accurate RV strain measurement during follow-up studies, RV longitudinal strain should be assessed from the RV focused apical fourchamber view [40]. Both RV free wall and septum are divided into three equal segments (basal, mid, and apical). RV strain is measured as the average of the peak systolic longitudinal strain values in three myocardial segments of the RV free wall (“RV free wall longitudinal strain”) or the average between the strain values of all six segments of the RV free wall and interventricular septum (“RV global longitudinal strain” or “RV four-chamber longitudinal strain”) (Fig. 8, panel F). It’s worth noting, that although term “global” longitudinal strain is supposed to represent the longitudinal deformation of the whole RV, none of commercially available algorithms is capable of providing such an information. The RV free wall strain is generally higher than RV four-chamber longitudinal strain [41]. Recently published EACVI/ASE/Industry Task Force document to standardize the deformation imaging recommends routine reporting of the peak systolic values of RV free wall longitudinal strain, with other parameters specified explicitly [40]. Spectral Doppler tracings of the tricuspid and pulmonary valves can be used to define the end-diastole and end-systole.
In the large reference study performed on 276 health volunteers the mean value of RV four-chamber longitudinal strain was -24,7±2,6% (lower limit of normality -20,0%) for men and -26,7±3,1% (-20,3%) for women; while the mean value of RV free wall longitudinal strain was -29,3±3,4% (-22,5%) for men and -31,6±4,0% (-23,3%) for women [42]. This was in agreement with previously published meta-analysis of 8 studies involving 486 healthy individuals with the value of RV free wall strain of -27±2% [42]. In the 2015 ASE/EACVI guidelines for cardiac chamber quantification, the reference values of RV free wall strain were given as -29,0±4,5% (abnormality threshold >-20%) [20].
Potential limitations of 2DSTE RV longitudinal strain include dependence on image quality, loss of speckles due to excessive motion of RV free wall, intervendor variability, and analysis of myocardial deformation only in one plane [42][43]. Unlike 2DSTE, 3DE enables the echocardiographic assessment of RV myocardial deformation in all planes and various directions (longitudinal, circumferential and area strain), similar to CMR. Good inter- and intraobserver reproducibility was demonstrated in a heterogeneous group of patients for all measurements of 3DE RV strain with correlation coefficients 0,7-0,9 [44]. In patients with pulmonary hypertension, area strain was a strong predictor of mortality and correlated with RV EF and, suggesting the superiority of 3DE-derived area strain over other deformation parameters [45]. However, an added value of 3DE-derived strain in routine clinical practice is yet to be proven, given the fact that only small number of patients have been investigated to date.
RV dyssynchrony
Assessment of RV dyssynchrony is a new promising approach to evaluate the RV dysfunction and to obtain prognostic information in patients with different cardiac conditions. While in early studies interventricular and RV intraventricular dyssynchrony were described in pulmonary arterial hypertension and demonstrated strong correlation with the extent of RV dysfunction, pulmonary artery pressures and adverse RV remodeling [46][47], the latest research is focused on the role of RV dyssynchrony in prediction of arrhythmic events and mortality in patients with arrhythmogenic RV cardiomyopathy [48][49].
RV dyssynchrony can be assessed by measuring IVS-RV free wall delay obtained by tissue Doppler imaging or 2DSTE algorithms. The most commonly used parameter of the RV intraventricular dyssynchrony is 2DSTE-derived mechanical dispersion index. It is calculated as the standard deviation of the time to peak-systolic strain for the RV free wall and septal segments in RV-focused apical fur-chamber view corrected to the R-R interval. The reference values to identify RV intraventricular dyssynchrony have been established in a small cohort of healthy individuals and a cutoff value of 18 ms was introduced as a criterion for RV dyssynchrony [50]. It has been demonstrated that RV mechanical dispersion index is an independent predictor of unfavorable prognosis in patients with pulmonary hypertension, and that RV dyssynchrony might regress as a result of effective therapy.
In population of patient with arrhythmogenic RV cardiomyopathy, mechanical dispersion was significantly increased not only in symptomatic patients with ventricular arrhythmias, but also in those in early phase of the disease and even in asymptomatic mutation carriers, indicating subclinical myocardial involvement and highlighting that this parameter may serve as a risk stratification tool and help in decision making regarding prophylactic treatment [48][49]. More studies are needed to test clinical and prognostic importance of RV dyssynchrony in other conditions.
Conclusions
RV systolic dysfunction is a strong and independent predictor of adverse outcomes and mortality in a variety of cardiovascular conditions. Accurate assessment of the RV performance is crucial for risk stratification and management of the patients. However, the accurate evaluation of the RV by conventional echocardiography remains challenging due to intrinsic limitations of this imaging modality and complex RV geometry and mechanisms of RV contraction. Recent developments in echocardiographic imaging such as 3DE and speckle-tracking enable more accurate and reproducible assessment of the RV systolic function. Combined results generated using different echocardiographic techniques will provide deeper insights into the RV pathology, resulting in more accurate diagnosis and better clinical management of patients with cardiovascular diseases.
Чтобы читать статью войдите с логином и паролем от scardio.ru
Keywords
For citation
Surkova E., Kov?cs A. Comprehensive Echocardiographic Assessment of the Right Ventricular Performance: beyond TAPSE and Fractional Area Change. Russian Journal of Cardiology. 2020;25(3S):4067. https://doi.org/10.15829/1560-4071-2020-4067
Copy